Table of contents
We have to agree on the fact that, there aren’t many graph plotting libraries for Android. Two of the most popular options that I have known are GraphView and MpAndroidCharts. Although, both of this graph plotting libraries are quite good and provide a wide variety of graphs. But for some specific use cases, these graphs still lack some features which might be necessary while plotting a continuous stream of data.
The Problem

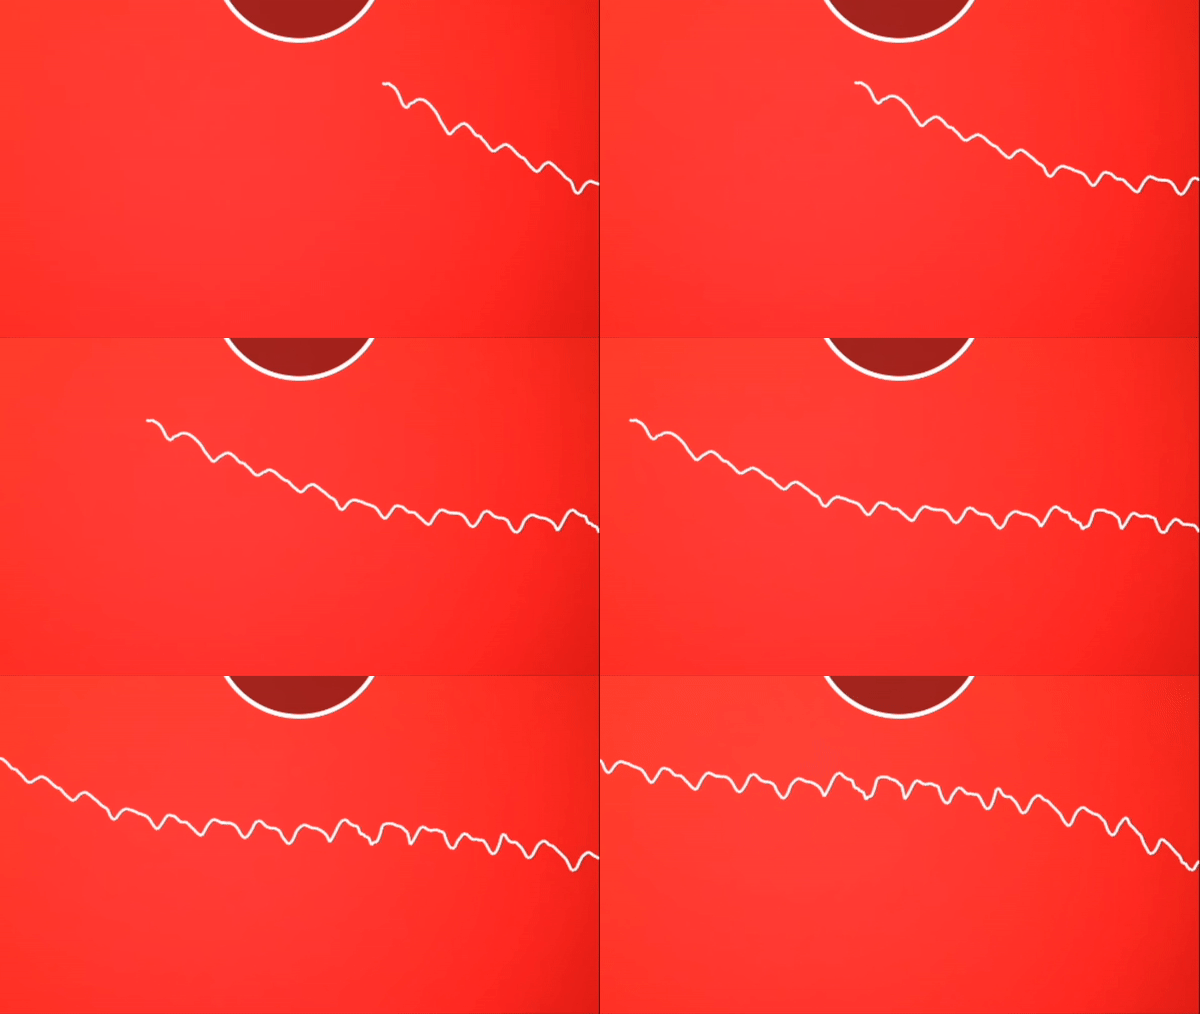
Graph Plotting Library Output (This image shows, how the incoming data is being plotted and scale is being changed in real-time based on the data points that we can see on the screen )
Let’s just understand the scenario first so that we can have a clear idea about what we are dealing with. We all can agree that to make a mechanism, we have to know what inputs we have and what is the expected output.
We have a stream that generates floating point data in an interval of 25 ms. ( Yes, it’s really fast ). We have to plot this stream of data simultaneously as it is generated. Now, at this point, some of us might think the display refreshes at 60Hz and hence, it is quite not possible. But we will discuss that in more detail later in some other article.
Wait, but that’s not all. Just like any DSA question, there are some constraints, here we have a few constraints as well.
Here, we have to implement a system that already has the following things running —
CameraX is being used, which means, a thread is already working to show the camera preview. Note that, using a camera takes up a lot of RAM because of the image buffer.
Secondly, we have an image analyser, that processes each image buffer frame in 25 ms and provides some output. This is running in some other thread.
We are also using the Android NDK library for preprocessing the image buffer data.
We also have a Lottie animation playing while the camera doesn’t detect any signal.
All these processes really take a toll on the device and hence, plotting and showing the stream of data would definitely should efficient, and performant without affecting user experience.
Keeping all these things in mind, we have to do a little bit of research in this field as to how we can actually create such a graph plotting library.
Research
The first and foremost thing that we need to do is we should try to find some graph plotting libraries with similar features. We can also explore some of the StackOverflow threads which could help us lead on the right path of research.
After some thorough research, I came to know, no such library exists that is open-source. There might be some paid libraries, but, I didn’t have a budget.
Hence, the only option that remains for me is to create a custom view that can solve all these problems. Surface View is something that can be useful for the first problem. The benefit of using Surface View is that it can be updated at any point in time, and that can be less than 60Hz. Check this StackOverflow thread.
Some of the resources that I found are from Google themselves.
Trust me, these are the best resource that helped me till the end to figure out so many things related to Surface View and how to handle it.
Approach
If you have looked at the GitHub repository, probably, you must have understood how to work with Surface View and we will be doing something similar.
Gist on how to work with Surface View
The above code block shows, how to properly set up Surface View as a custom view in android and set up a background thread that starts when a surface is created and stops when the surface is destroyed. Though something that we have to keep in mind is that in the surface view, each time, we want to draw on the surface view we need a new canvas and that new canvas is provided by the initialisation of the surface holder.
This means that, if we want to draw a continuous line, we have to redraw previous points again and again with each iteration.
I think this clearly says, how complicated it is to understand this custom view.
The next thing that we have to think about is that,
How can we actually show the data points?
How to handle the condition where we need to redraw the earlier points?
What other issues I could face while displaying the data?
How do they scale the graph and also make sure it looks the same on each and every device?
These are some of the questions that we need to answer.
Since this blog is really getting stretched a bit too far, I have decided to release it in parts so that, it becomes easier for everyone to consume in small doses.
Conclusion
There are a lot of factors that contribute to how we are going to implement this system. In this series, you will also, know the real use of mutex locks in android, and trust me that feeling is incredible when you know something from your academics and it’s being used. So, let’s explore more on this in the upcoming blog.

